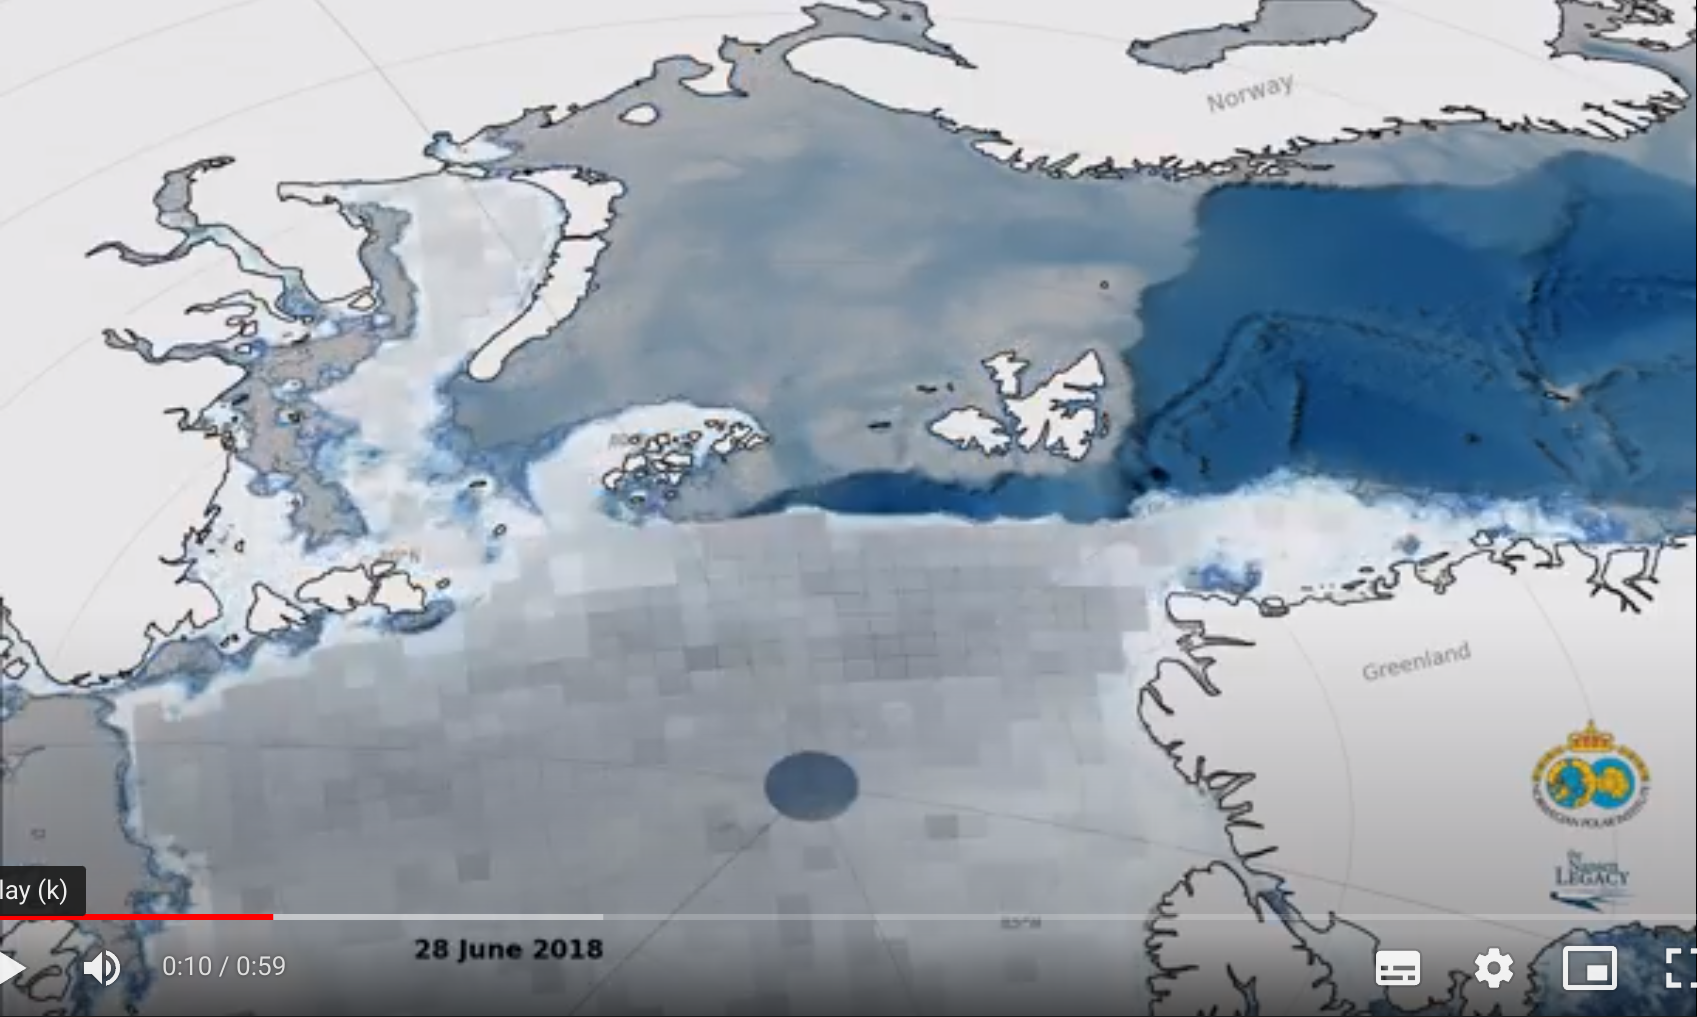
In the Nansen Legacy Project, researchers work to understand how sea ice in the Northern Barents Sea behaves. We see a lot of static imagery and graphs of sea ice, this project attempts to add a more dynamic perspective.
Using sea ice extent, concentration and motion data this short film shows daily sea ice state for the years of the Nansen Legacy project. It highlights how much variability exists in the system, and where this variability exists. Importantly, it shows that what happens between sampling missions is critically important – we should avoid simple inferences about the ice state in between times that sampling happened. Full video: https://drive.google.com/drive/folders/1HurY1GDELpx4PqRLyTDUURKbIrQAucfw
Cartography and visualisation in Python using Cartopy, video assembled with ffmpeg. Coastline from Openstreetmap, bathymetry is merged IBCAOv4 and GEBCO. Sea ice edges are NSIDC’s MASIE product, ice concentration is from the University of Bremen.